librarian::shelf(
  tidyverse
  , sf
  , PeruData
  , cowplot
)


PeruData::mef_ppr(
    "2021"
    , '.xlsx'
    , to = "data/peru-opendata/ppr-2021.xlsx"
    )
# fs::dir_tree("data")
ppr <-
  readxl::read_xlsx(
    here::here(
      "data"
      , "peru-opendata"
      , "ppr-2021.xlsx"
    )
    , range = "A4:R1196"
  ) |>
janitor::clean_names()Day 12
R
Data Viz
ggplot2
Data analysis
Day 12 from #30dataChartChallenge
ppr_t <-
  ppr |>
  select(
    gl = gobiernos_locales
    , avance = avance_percent
  ) |>
  mutate(

    ubigeo = str_sub(gl, 1, 6)
  ) |>
  filter(str_detect(gl, "PROVINCIAL")) |>
  left_join(ubigeo_peru) |>
  # select(avance, ubigeo) |>
  # left_join(PeruData::ubigeo_peru) |>
  select(depa, prov, dist, avance) |>
  left_join(map_peru_prov)


no_b <-
  ppr_t |>
  filter(avance < 70) |>
  count(depa) |>
  arrange(-n) |>
  slice(1:10) |>
  mutate(
    depa = fct_reorder(str_to_sentence(depa), n)
    , n = as.integer(n)
  )
p1 <-
no_b |>
ggplot() +
aes(n, depa, group = depa, label = depa) +
scale_x_continuous(breaks = seq(0, 12, by = 3)) +
geom_point(
size = 9
, color = "#E5121A"
) +
geom_segment(
aes(
x = 0
, xend = n
, yend = depa
)
, size = 6
, color = "#E5121A"
) +
geom_text(
aes(x = 2.8)
# , nudge_x = 1.2
, color = "grey80"
, hjust = 1
, fontface = "bold"
, size = 3.5
) +
labs(
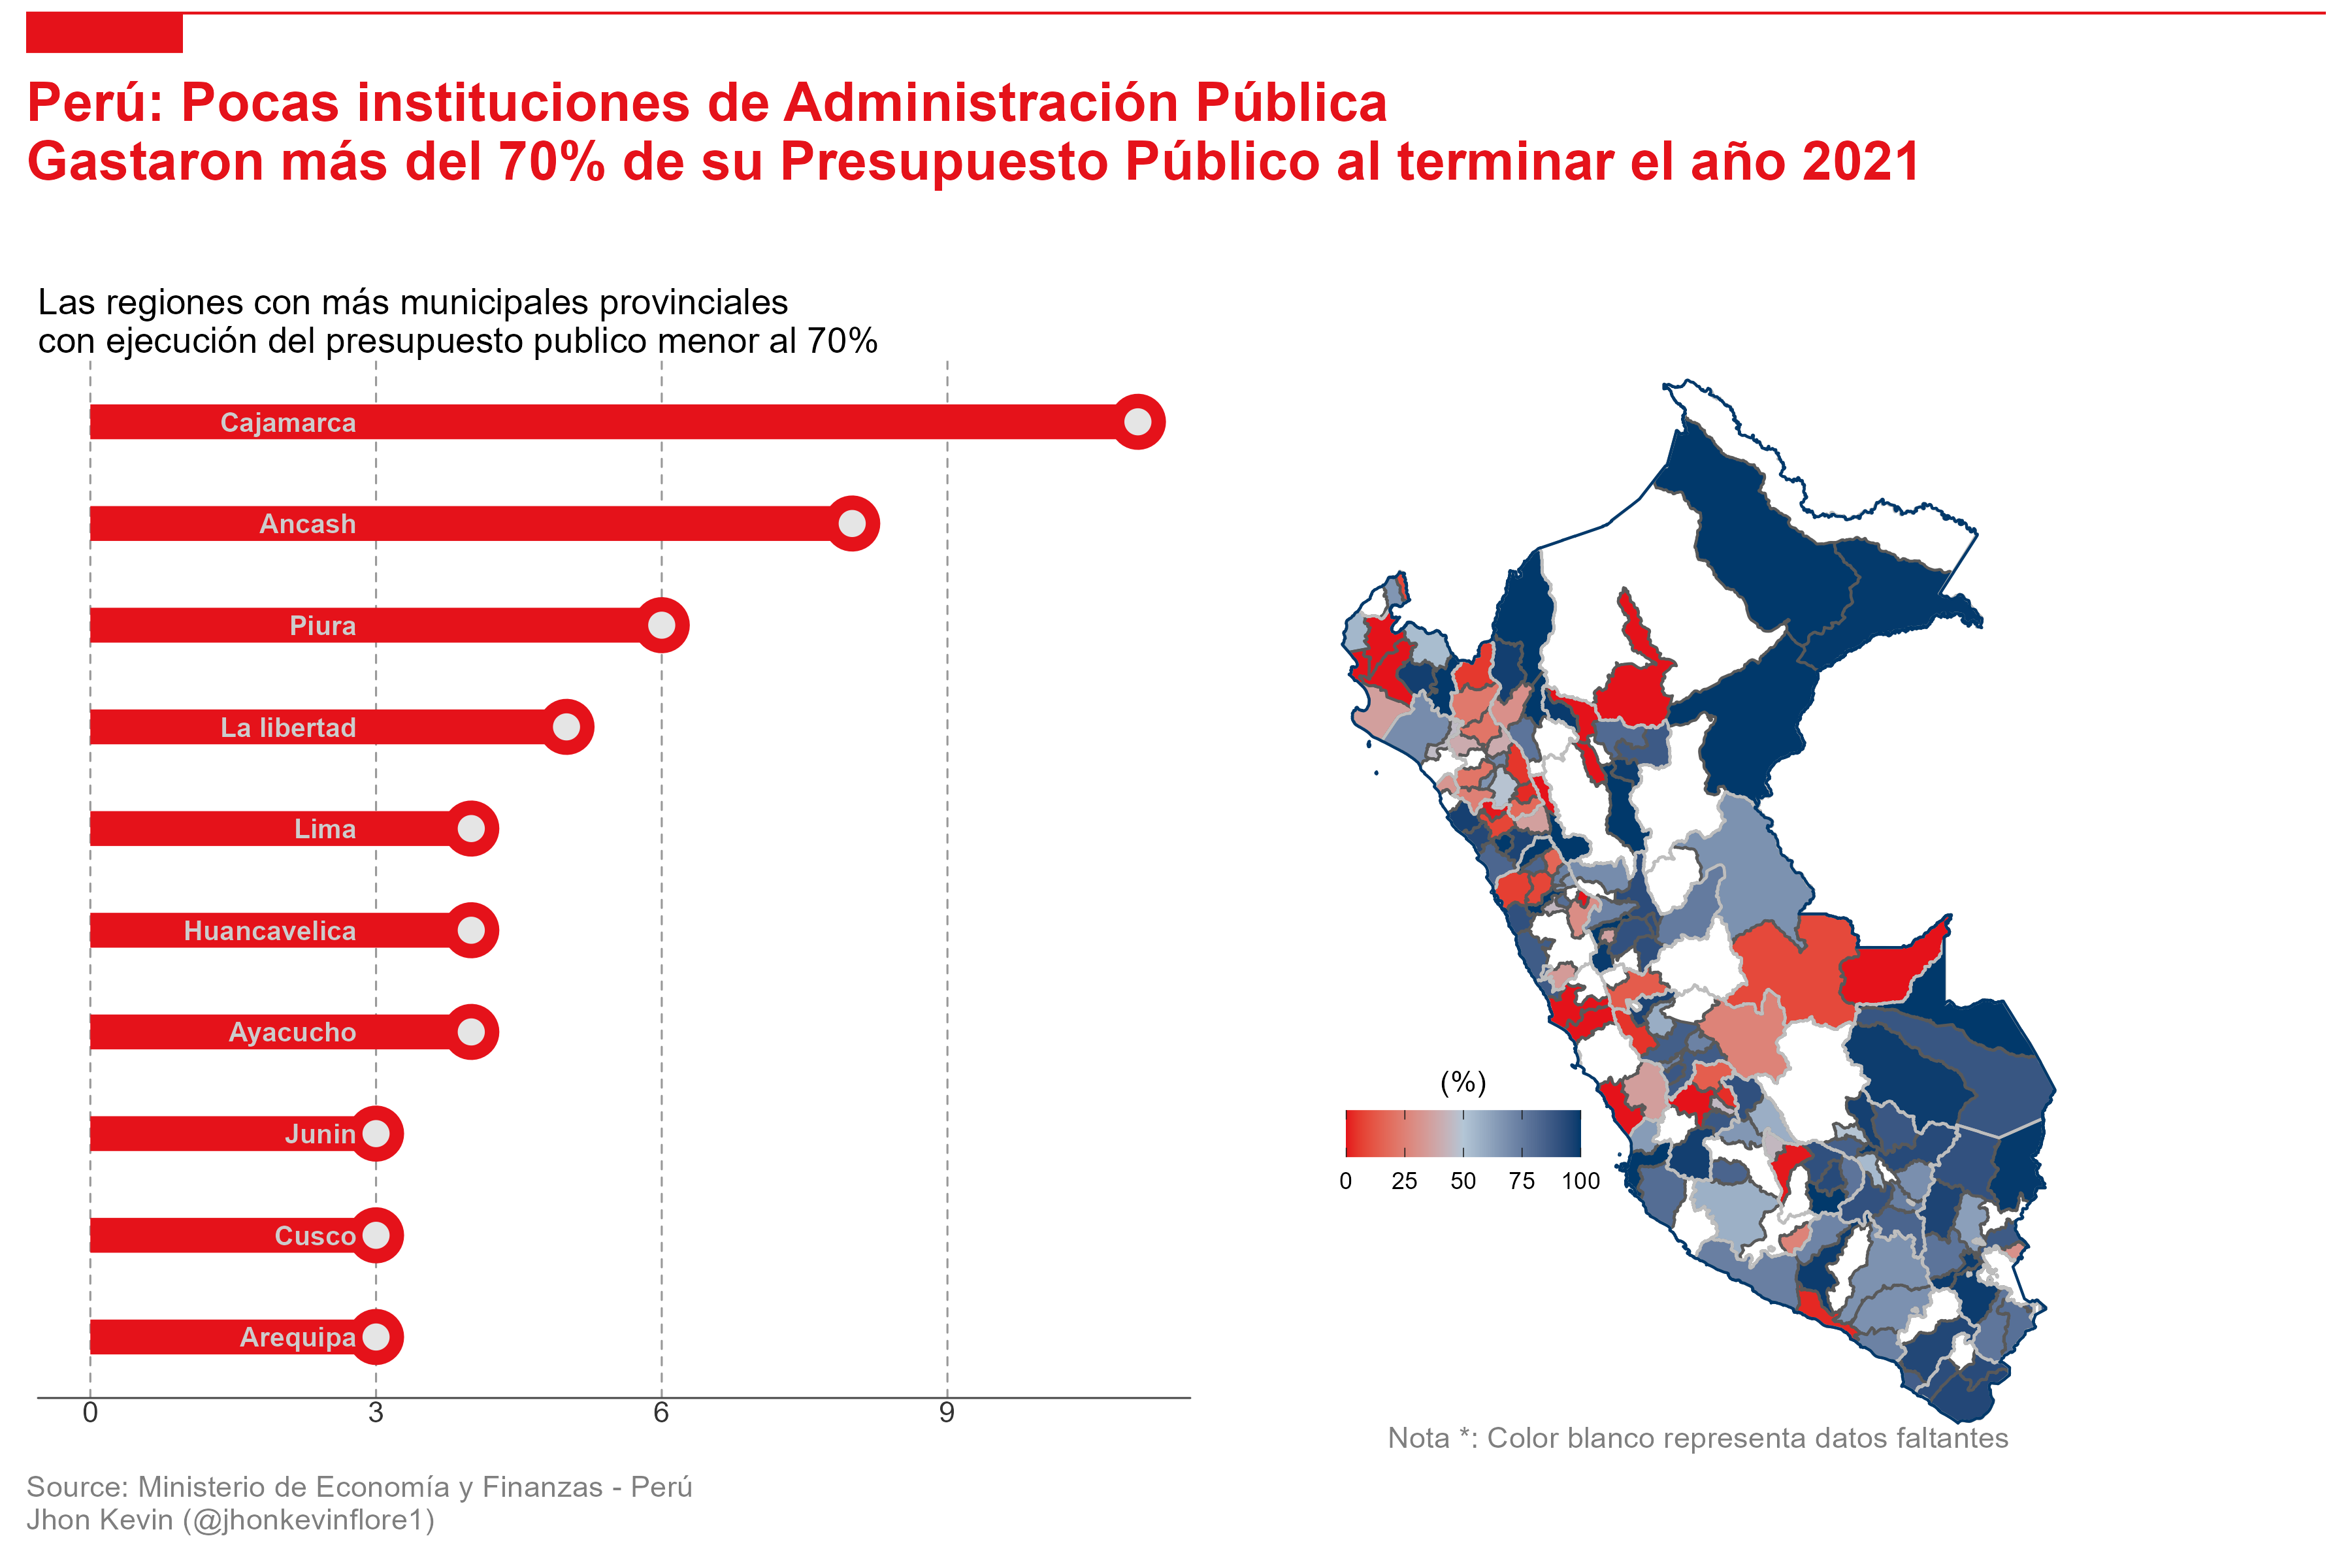
title = "Las regiones con más municipales provinciales\ncon ejecución del presupuesto publico menor al 70%"
) +
geom_point(size = 4, color = 'gray90') +
theme_void() +
theme(
panel.grid = element_blank()
, axis.line.x.bottom = element_line(color = "grey30")
, axis.text.x = element_text(color = "grey20")
, plot.margin = margin(1, 1, 1, 1, "cm")
, panel.grid.major.x = element_line(color = "grey60", linetype = "dashed")
, plot.background = element_blank()
, panel.background = element_blank()
, plot.title = element_text()
)
avance <- colorRampPalette(c("#E5121A", "#b3c6d6", "#01396b"))
p2 <-
ppr_t |>
ggplot() +
# geom_sf(data = map_peru_depa, fill = "#E5121A") +
geom_sf(aes(geometry = geometry, fill = avance)) +
geom_sf(data = map_peru_depa, fill = NA, color = "grey") +
geom_sf(data = map_peru_peru, fill = NA, color = "#01396b") +
labs(
# title = "Ejecución Presupuestal"
fill = "(%)"
) +
scale_fill_gradientn(
colours = avance(3)
) +
guides(
fill = guide_colorbar(
ticks.colour = "grey10"
, title.position = "top"
, title.hjust = .5
, direction = "horizontal"
)
) +
theme_void() +
theme(
legend.position = c(.2, .3)
, legend.direction = "horizontal"
# , legend.title = element_text(hjust = .5)
)ggdraw(x = c(0, 9), y = c(0, 1.2)) +
draw_plot(p1, width = 5, x = -.15, y = .05) +
draw_plot(p2, width = 3, x = 5, y = .01) +
draw_label(
"Perú: Pocas instituciones de Administración Pública\nGastaron más del 70% de su Presupuesto Público al terminar el año 2021"
, x = .1
, y = 1.1
, color = "#E5121A"
, hjust = 0
, size = 20
, fontface = "bold"
# , familyface = "bold"
) +
draw_line(
x = c(0.1, 8.9)
, y = rep(1.19, 2)
, color = "#E5121A"
) +
draw_line(
x = c(0.1, .7)
, y = rep(1.175, 2)
, color = "#E5121A"
, size = 7
) +
draw_label(
"Nota *: Color blanco representa datos faltantes"
, x = 6.5
, y = .1
, size = 11
, color = "grey50"
) +
draw_label(
"Source: Ministerio de Economía y Finanzas - Perú\nJhon Kevin (@jhonkevinflore1)"
, x = .1
, y = .05
, size = 11
, hjust = 0
, color = "grey50"
) +
theme(
plot.background = element_rect("white", color = NA)
)ggsave(
'plots/day12_dcc_22.png'
, height = 8
, width = 12
)knitr::include_graphics('plots/day12_dcc_22.png')