Day 19

R
Data Viz
ggplot2
Data analysis
Day 19 from #30dataChartChallenge
Fecha de publicación

19 de abril de 2022

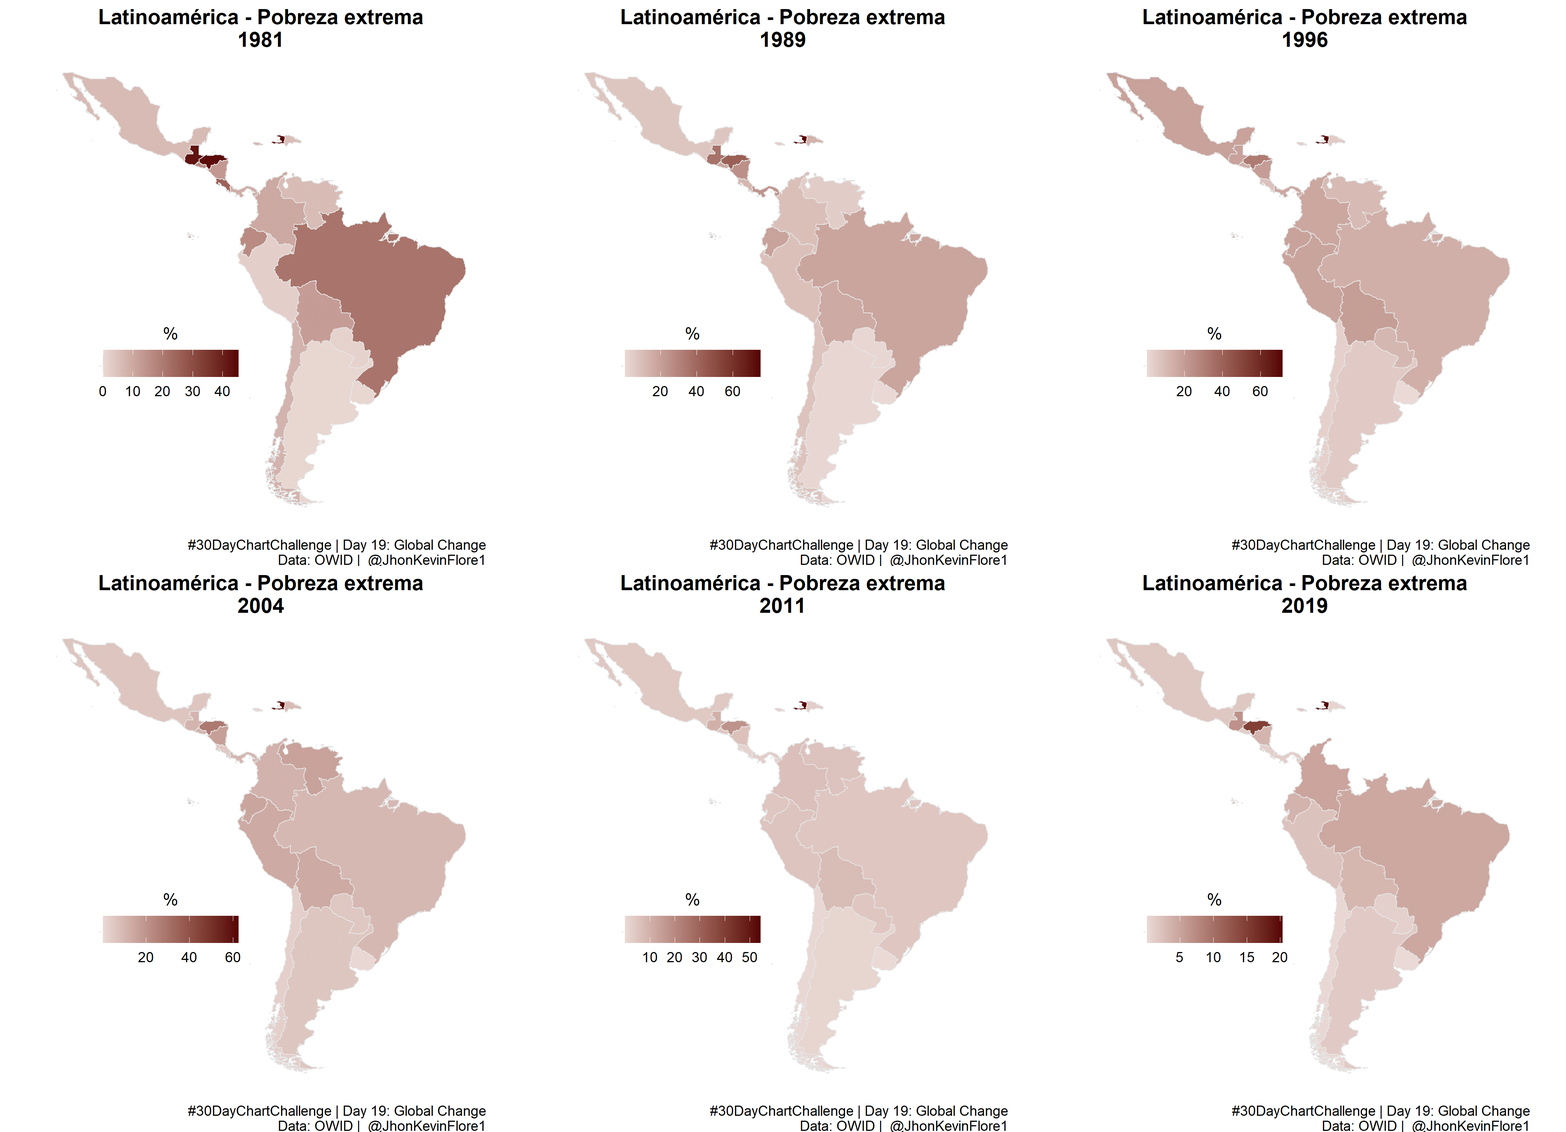
knitr::include_graphics('plots/day19_dcc_22.gif')
Code

librarian::shelf(
  tidyverse
  , gapminder
  , sf
  , maps
)

pover <- 
  read_csv(here::here("data", "owd", "extreme-poverty.csv")) |> 
  rename(
    country = 1
    , year = 3
    , pover = 4
  ) |> 
  mutate(
    country = ifelse(str_detect(country, "Argentina"), "Argentina", country)
  )
am_cnt <- 
  pover |> 
  left_join(gapminder, by = "country") |> 
  filter(
    continent == "Americas"
    ) |> 
  distinct(country) |> 
  pull()

pover_latam <-
  pover |> 
  filter(country %in% am_cnt) |> 
  # distinct(country) |> 
    # pull()
  select(!Code) 
latim <-
  map_data("world") |> as_tibble() |> rename(country = region) |> 
  filter(country %in% am_cnt) |> 
  right_join(pover_latam) |> 
  filter(country != "Canada")

t2 <- colorRampPalette(c("#ead9d5", '#560100'))
plot_fill <- function(anio){
  cli::cli_process_start("year {.val {anio}}")
  p <- latim |> 
    filter(year == anio) |> 
    ggplot() +
    aes(long, lat, group = paste(country, group), fill = pover) +
    geom_polygon(color = "gray90", size = .23) +
    coord_fixed() +
    scale_fill_gradientn(colors = t2(2)) +
    labs(
      title = glue::glue("Latinoamérica - Pobreza extrema", "\n{anio}")
      , caption = "#30DayChartChallenge | Day 19: Global Change\nData: OWID |  @JhonKevinFlore1"
      , fill = "%"
    ) +
    guides(
      fill = guide_colorbar(
        direction = "horizontal"
        , title.position = "top"
        , title.hjust = .5
        , label.hjust = .5
        , label.position = "bottom"
        , keywidth = .2
        , keyheight = .2
        
      )
    ) +
    theme_void() +
    # hrbrthemes::theme_ft_rc(grid = FALSE, axis_text_size = 0) +
    theme(
      legend.position = c(.3, .35)
      , legend.text = element_text()
      , plot.title = element_text(hjus = .5, face = "bold")
      , plot.subtitle = element_text( hjust = .5)
      , plot.caption = element_text(hjust = 1, vjust = .5)
      , plot.caption.position = 'panel'
    )
  plot(p)
  cli::cli_process_done()
}
plot_fill("1989")
ggsave(here::here("plots", "day19.png"))

animation::saveGIF({
  purrr::walk(unique(pover_latam$year), plot_fill)
  } , movie.name = here::here('plots/day19_dcc_22.gif')
  , interval = .5
  , ani.width = 1385
  , ani.height = 1500
  , ani.res = 300
)