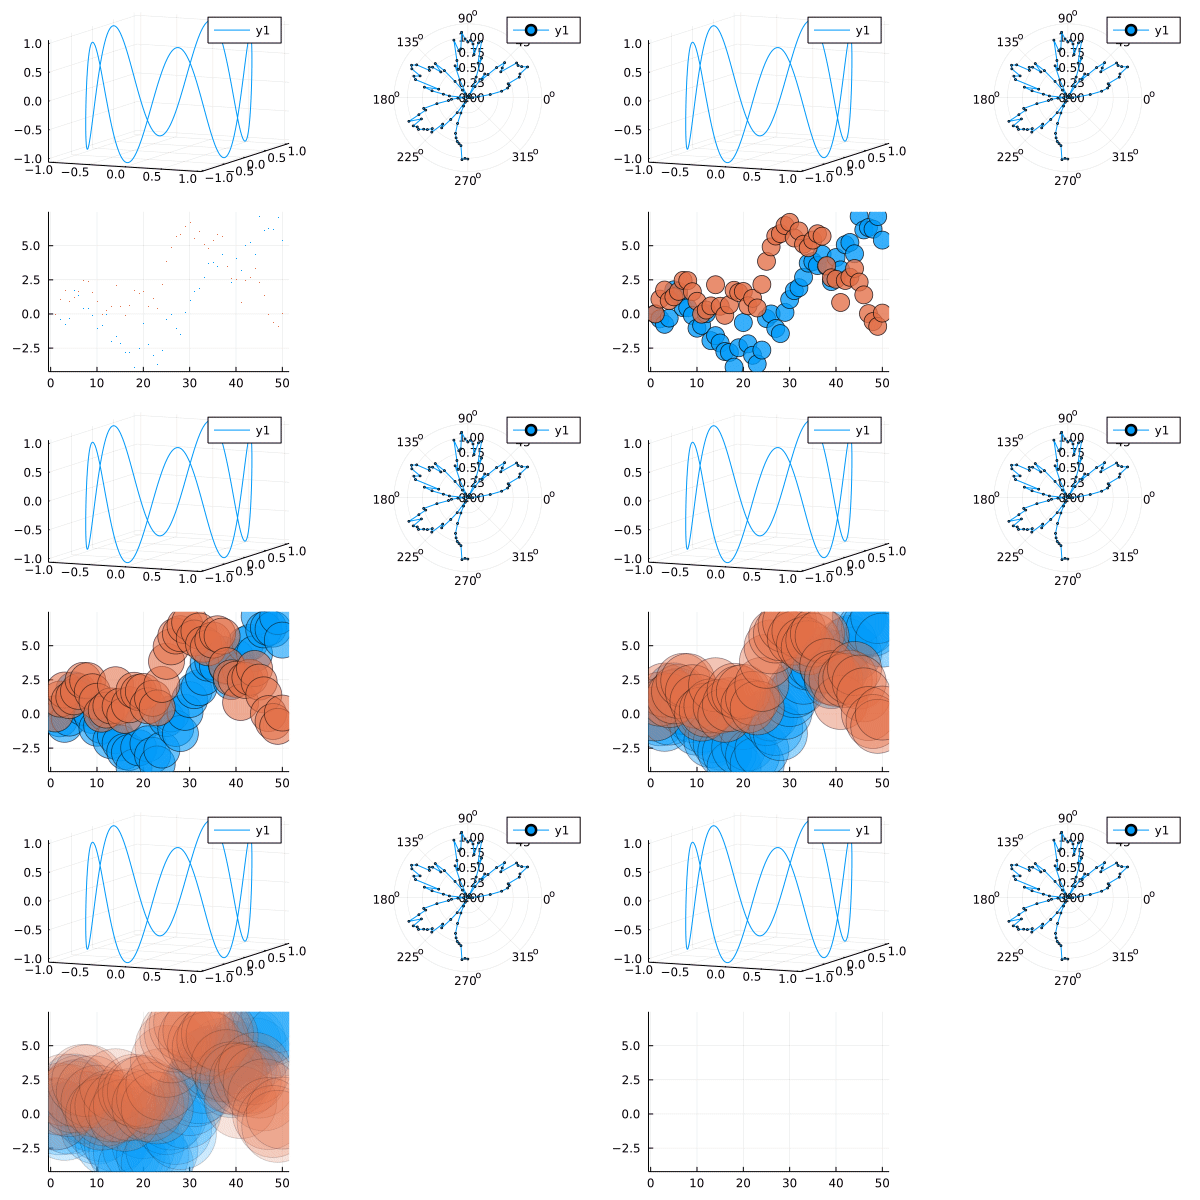
knitr::include_graphics('plots/day20_dcc_22.gif')
20 de abril de 2022
using Plots, Random

a = rand(50)
b = rand(50)

# scatter(x, y)

t = range(0, stop=10, length=1000)
x = cos.(t)
y = sin.(t)
z = sin.(5t)


Θ = range(0, stop = 1.5π, length = 100)
r = abs.(0.1 * randn(100) + sin.(3Θ))


anim = @animate for i in 1:50
    d3 = plot(x, y, z)
    s = scatter(Plots.fakedata(50, 2), ms=i, lab="", alpha = 1 - i/50)
    c = plot(Θ, r, proj = :polar, m = 2)
    plot(d3, c, s)
    # scatter!(cumsum(randn(i)), ms=i)
end

gif(anim, "plots/day20.gif", fps=50)
# gif