p <-
gast |>
select(anio, desc_pliego, departamento:ejecucion) |>
mutate(
p = ejecucion / pim
, anio = factor(anio, unique(gast$anio))
, departamento = ifelse(str_detect(departamento, "CALLAO"), "CALLAO", departamento) |> str_to_sentence()
, departamento = fct_reorder2(departamento, anio, -p)
) |>
filter(
# p < 2,
anio != 2015
) |>
ggplot() +
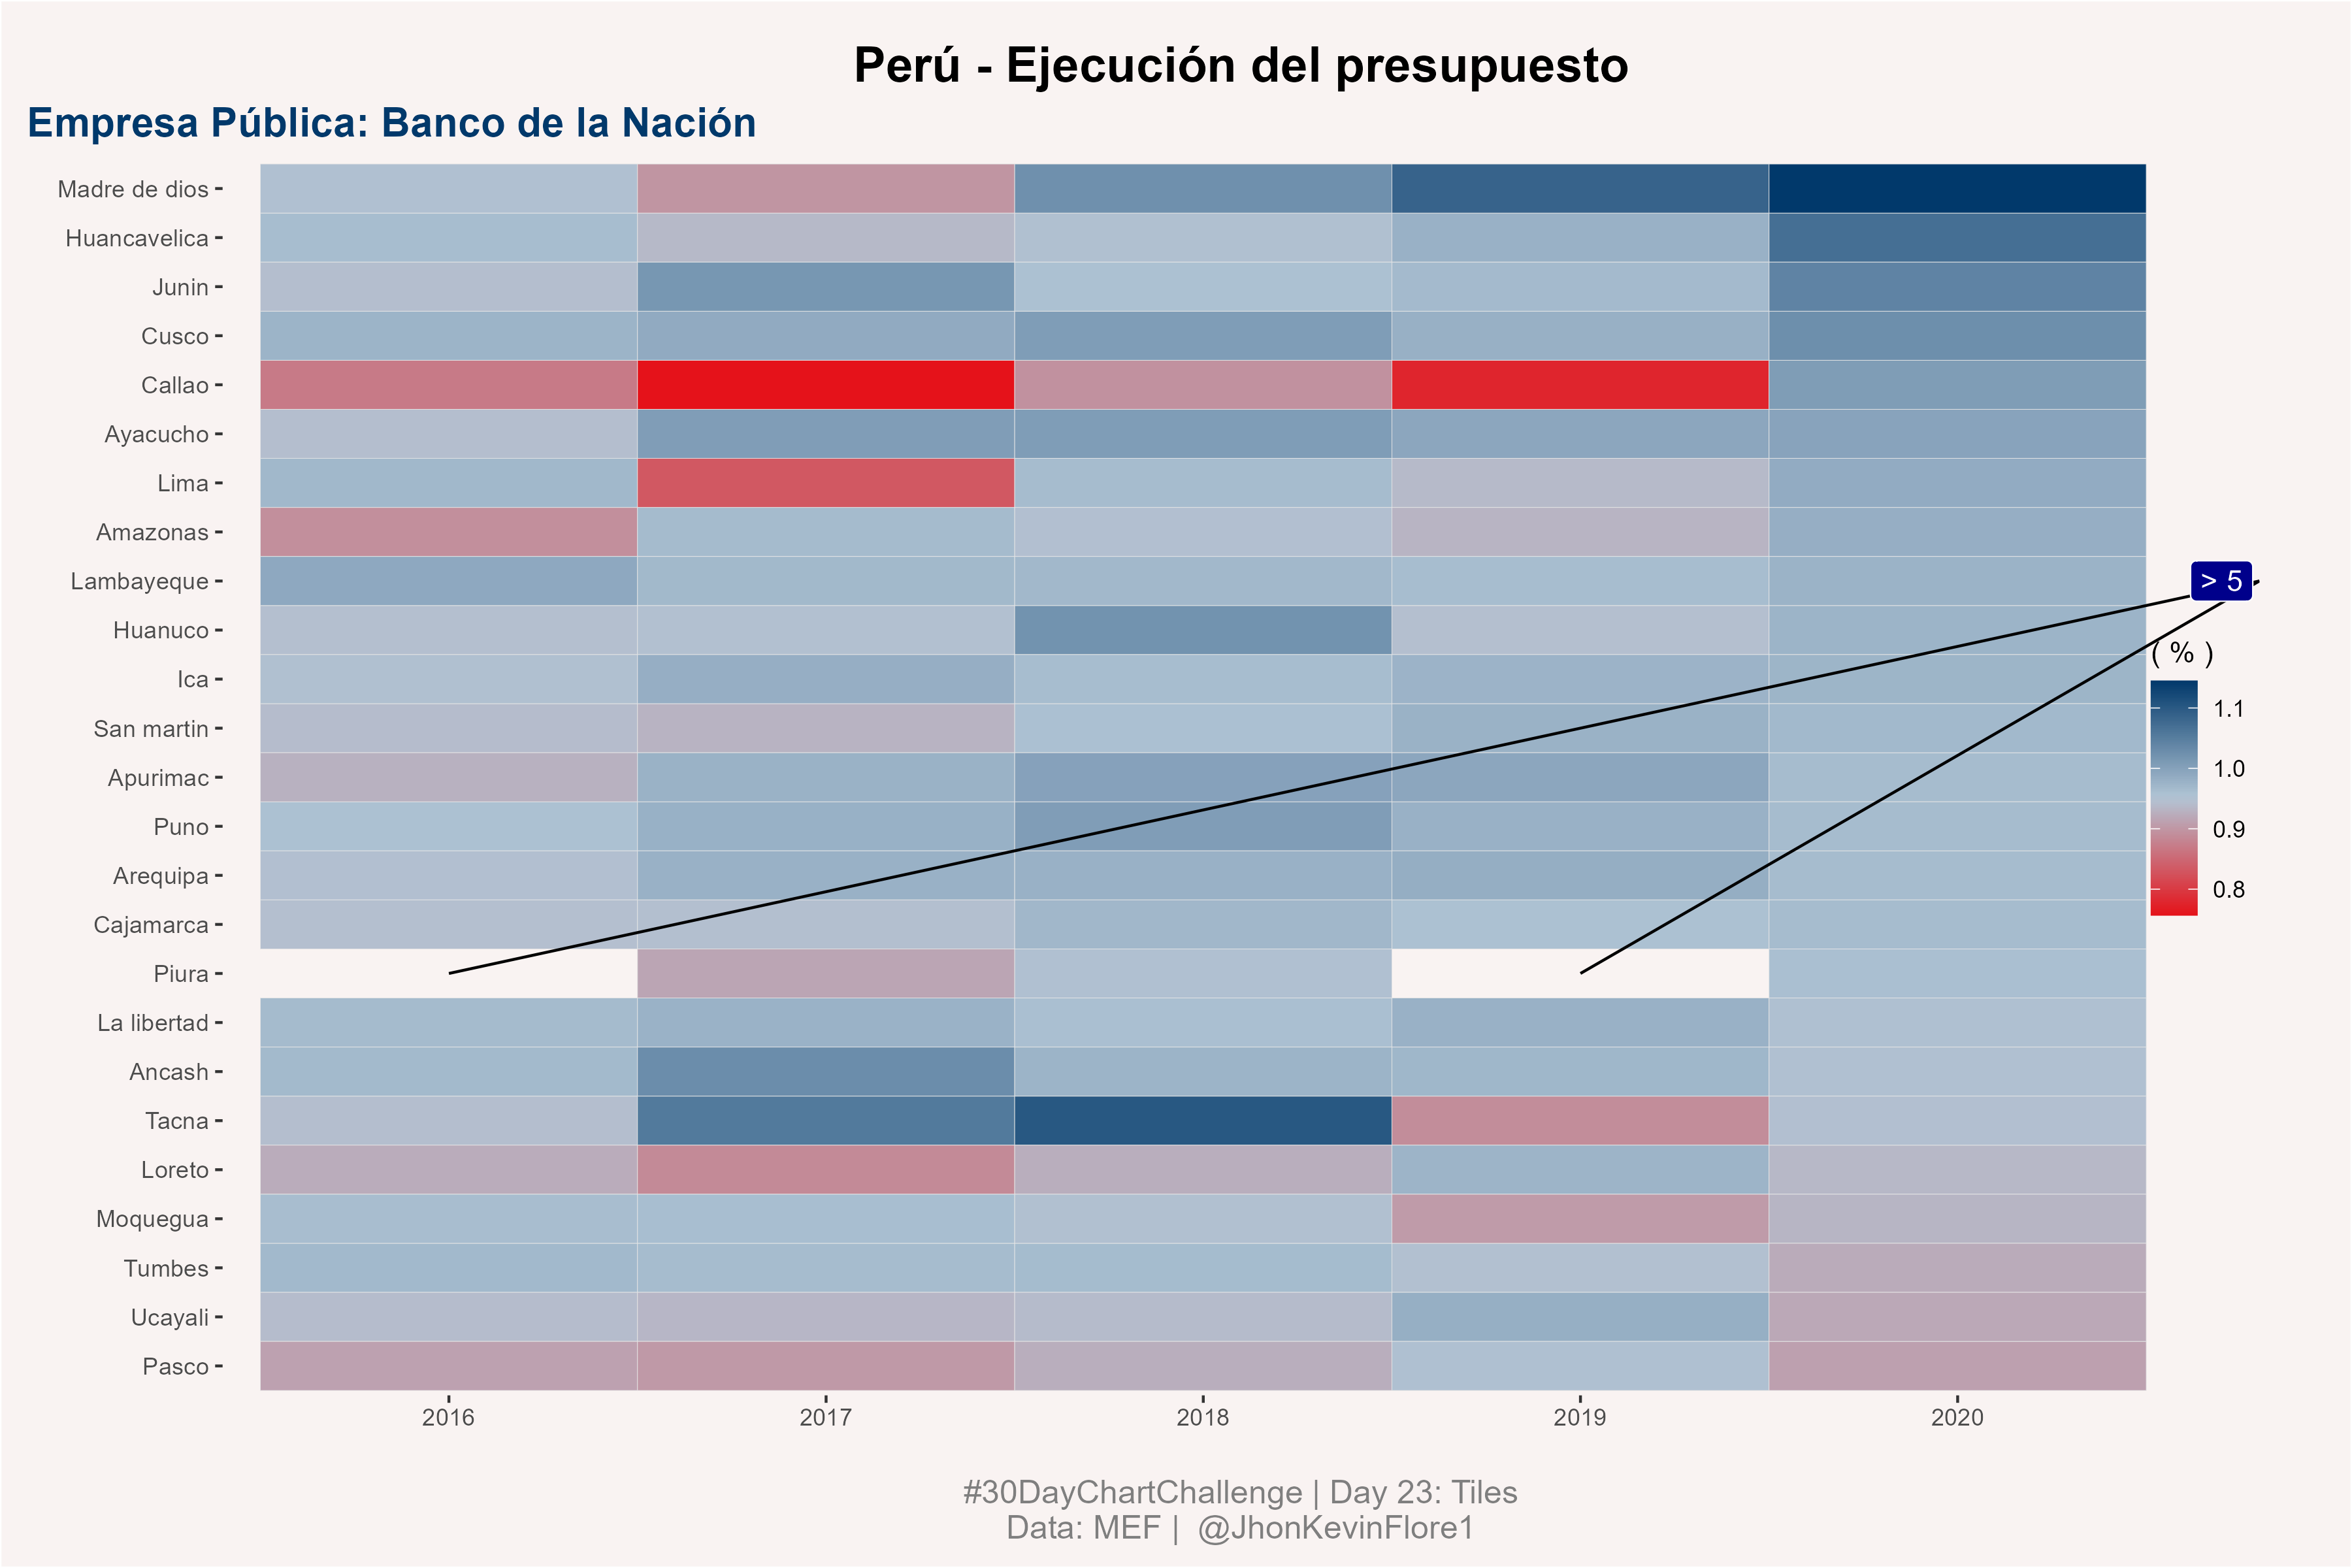
aes(anio, departamento, fill = p) +
geom_tile(color = "grey90") +
labs(
x = ""
, y = ""
, title = "Perú - Ejecución del presupuesto"
, subtitle = "Empresa Pública: Banco de la Nación"
, caption = "#30DayChartChallenge | Day 23: Tiles\nData: MEF | @JhonKevinFlore1"
, fill = "( % )"
) +
annotate(
"segment"
, x = 1
, y = 9
, xend = 5.8
, yend =17
, color = "black"
) +
annotate(
"segment"
, x = 4
, y = 9
, xend = 5.8
, yend =17
, color = "black"
) +
annotate(
"label"
, label = "> 5"
, x = 5.7
, y = 17
, fill = "darkblue"
, color = "white"
) +
scale_fill_gradientn(colours = avance(30)) +
theme(
plot.background = element_rect("#f9f3f2")
, legend.position = c(.97, .5)
, panel.grid.major = element_blank()
# , panel.grid.major.x = element_line(linetype = 4, color = "gray60")
, plot.caption = element_text(hjust = .5, color = "grey50", size = 12)
, plot.title = element_text(hjust = .5, size = 18, face = "bold")
, plot.subtitle = element_text(hjust = -.15, color = "#01396b", size = 15, face = "bold")
, panel.background = element_rect("#f9f3f2")
, legend.background = element_blank()
, plot.margin = margin(.6, 1.2, .3, .3, unit = "cm")
# , legend.text = element_text(size = 16)
# , legend.key.width = unit(22, "mm")
)
ggsave(
'plots/day23_dcc_22.png'
, plot = p
, width = 12
, height = 8
)