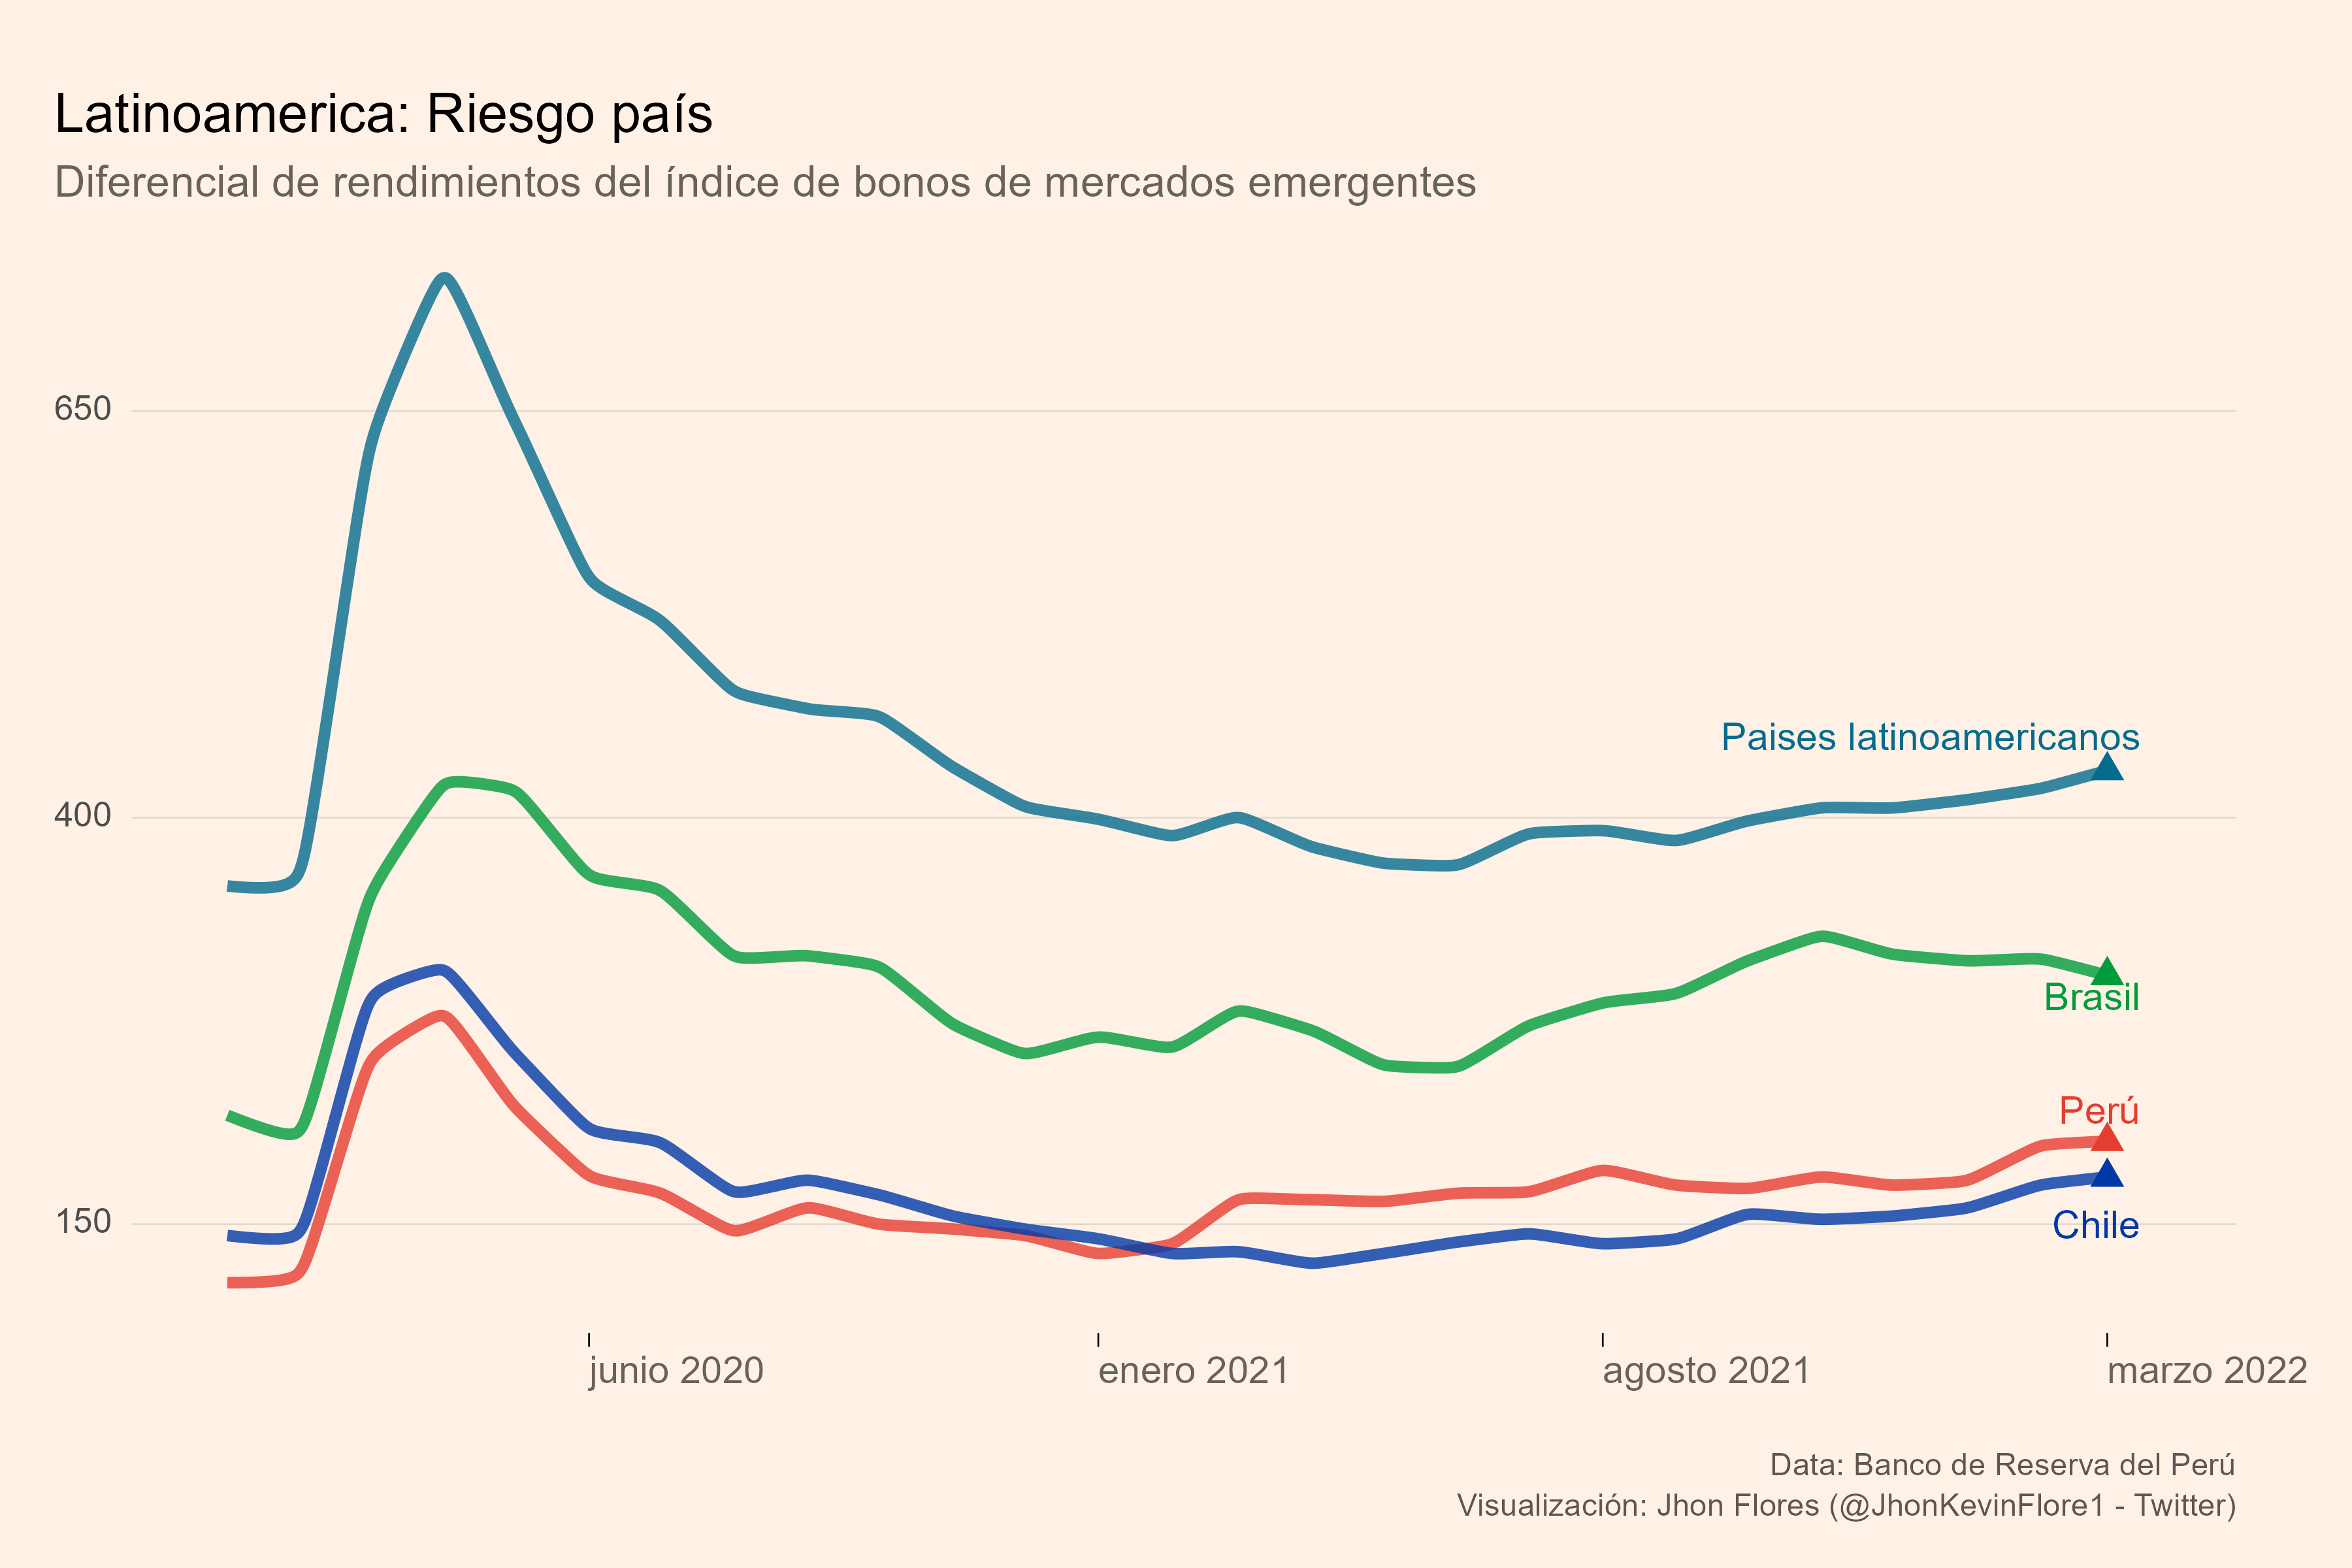
knitr::include_graphics('plots/day24_dcc_22.png')
24 de abril de 2022
librarian::shelf(
  tidyverse
  , lubridate
  , PeruData
  , ggtext
)

rp <-
  c(
    "https://estadisticas.bcrp.gob.pe/estadisticas/series/mensuales/resultados/PN01136XM/html"
    , "https://estadisticas.bcrp.gob.pe/estadisticas/series/mensuales/resultados/PN01135XM/html"
    , "https://estadisticas.bcrp.gob.pe/estadisticas/series/mensuales/resultados/PN01134XM/html"
    , "https://estadisticas.bcrp.gob.pe/estadisticas/series/mensuales/resultados/PN01133XM/html"
    , "https://estadisticas.bcrp.gob.pe/estadisticas/series/mensuales/resultados/PN01132XM/html"
    , "https://estadisticas.bcrp.gob.pe/estadisticas/series/mensuales/resultados/PN01131XM/html"
    , "https://estadisticas.bcrp.gob.pe/estadisticas/series/mensuales/resultados/PN01130XM/html"
    , "https://estadisticas.bcrp.gob.pe/estadisticas/series/mensuales/resultados/PN01129XM/html"
    , "https://estadisticas.bcrp.gob.pe/estadisticas/series/mensuales/resultados/PN01137XM/html"
    )

rp_1 <-
  bcrp_get(rp)
# glimpse(rp_1[[1]])

bcrp_clean <- function(.bcrp_data){
  Sys.setlocale("LC_ALL", "Spanish")
  id = str_sub(names(.bcrp_data)[2], -10, -1)
  .bcrp_data |>
    rename(f = 1, rp = 2) |>
    mutate(
      f = str_replace_all(f, "Set", "Sep") |>
        str_to_lower()
      , f = paste("01.", str_sub(f, 1, 3), ".", str_sub(f, -2, -1), sep = "") |>
        lubridate::dmy()
      , rp = as.numeric(rp)
    ) |>
    add_column(.id = id)
}


rp_latam <-
  rp_1 |>
  map_df(bcrp_clean) |>
  filter(str_detect(.id, "peru|brasil|chile|ca"), lubridate::year(f) > 2019) |>
  mutate(.id = case_when(
    str_detect(.id, "peru") ~ "Perú"
    , str_detect(.id, "chile") ~ "Chile"
    , str_detect(.id, "brasil") ~ "Brasil"
    , T ~ "Paises latinoamericanos"
    )
    , .id = fct_reorder2(.id, f, rp)
  )

# levels(rp_latam$.id)
theme_ft <- function(...) {
  text_color <- "#68625D"
  color_cases <- "#71C8E4"
  color_cases_text <- "#258BC3"
  color_deaths <- "#CE3240"
    theme_minimal(base_family = "Outfit Medium", base_size = 16) +
      theme(
        plot.background = element_rect(color = NA, fill = "#FFF1E5"),
        panel.background = element_rect(color = NA, fill = NA),
        panel.grid = element_blank(),
        panel.grid.major.y = element_line(color = "#E3DACE", size = 0.3),
        text = element_text(color = text_color, lineheight = 1.3),
        plot.title = element_textbox(color = "#040000", family = "Outfit Medium",
                                     face = "plain", size = 20, width = 1),
        plot.title.position = "plot",
        plot.subtitle = element_markdown(family = "Outfit Medium"),
        plot.caption = element_markdown(
          family = "Outfit", hjust = 1, size = 11.5, color = "#5E5751"),
        plot.caption.position = "plot",
        axis.title = element_blank(),
        axis.text.x = element_text(hjust = 0, color = text_color, size = 14),
        axis.text.y.left = element_markdown(family = "Outfit Medium"),
        axis.text.y.right = element_markdown(family = "Outfit Medium"),
        axis.ticks.x = element_line(size = 0.3),
        axis.ticks.length.x = unit(1.8, "mm"),
        plot.margin = margin(t = 12, b = 6, l = 7, r = 15, "mm"),
        strip.text = element_blank(),   # remove default facet titles
        ...
      )
} p <- rp_latam |>
# names()
ggplot() +
aes(f, rp, group = .id, color = .id) +
geom_point(data = filter(rp_latam, f == max(f)), aes(f, rp, color = .id), shape = 17, size = 4) +
ggalt::geom_xspline(size = 2, alpha = .8) +
scale_color_manual(
values = clrs
) +
labs(
x = "", y = "",
title = "Latinoamerica: Riesgo país"
, subtitle = "Diferencial de rendimientos del índice de bonos de mercados emergentes"
, caption = "<br/>Data: Banco de Reserva del Perú<br/>
Visualización: Jhon Flores (@JhonKevinFlore1 - Twitter)"
) +
scale_x_date(date_breaks = "7 months", date_labels = "%B %Y") +
scale_y_continuous(breaks = seq(150, 800, by = 250)) +
lb_a(450, 1) +
lb_a(290, 2) +
lb_a(220, 3) +
lb_a(150, 4) +
theme_ft(
legend.position = "none"
)
ggsave(
'plots/day24_dcc_22.png'
, plot = p
, width = 12
, height = 8
)