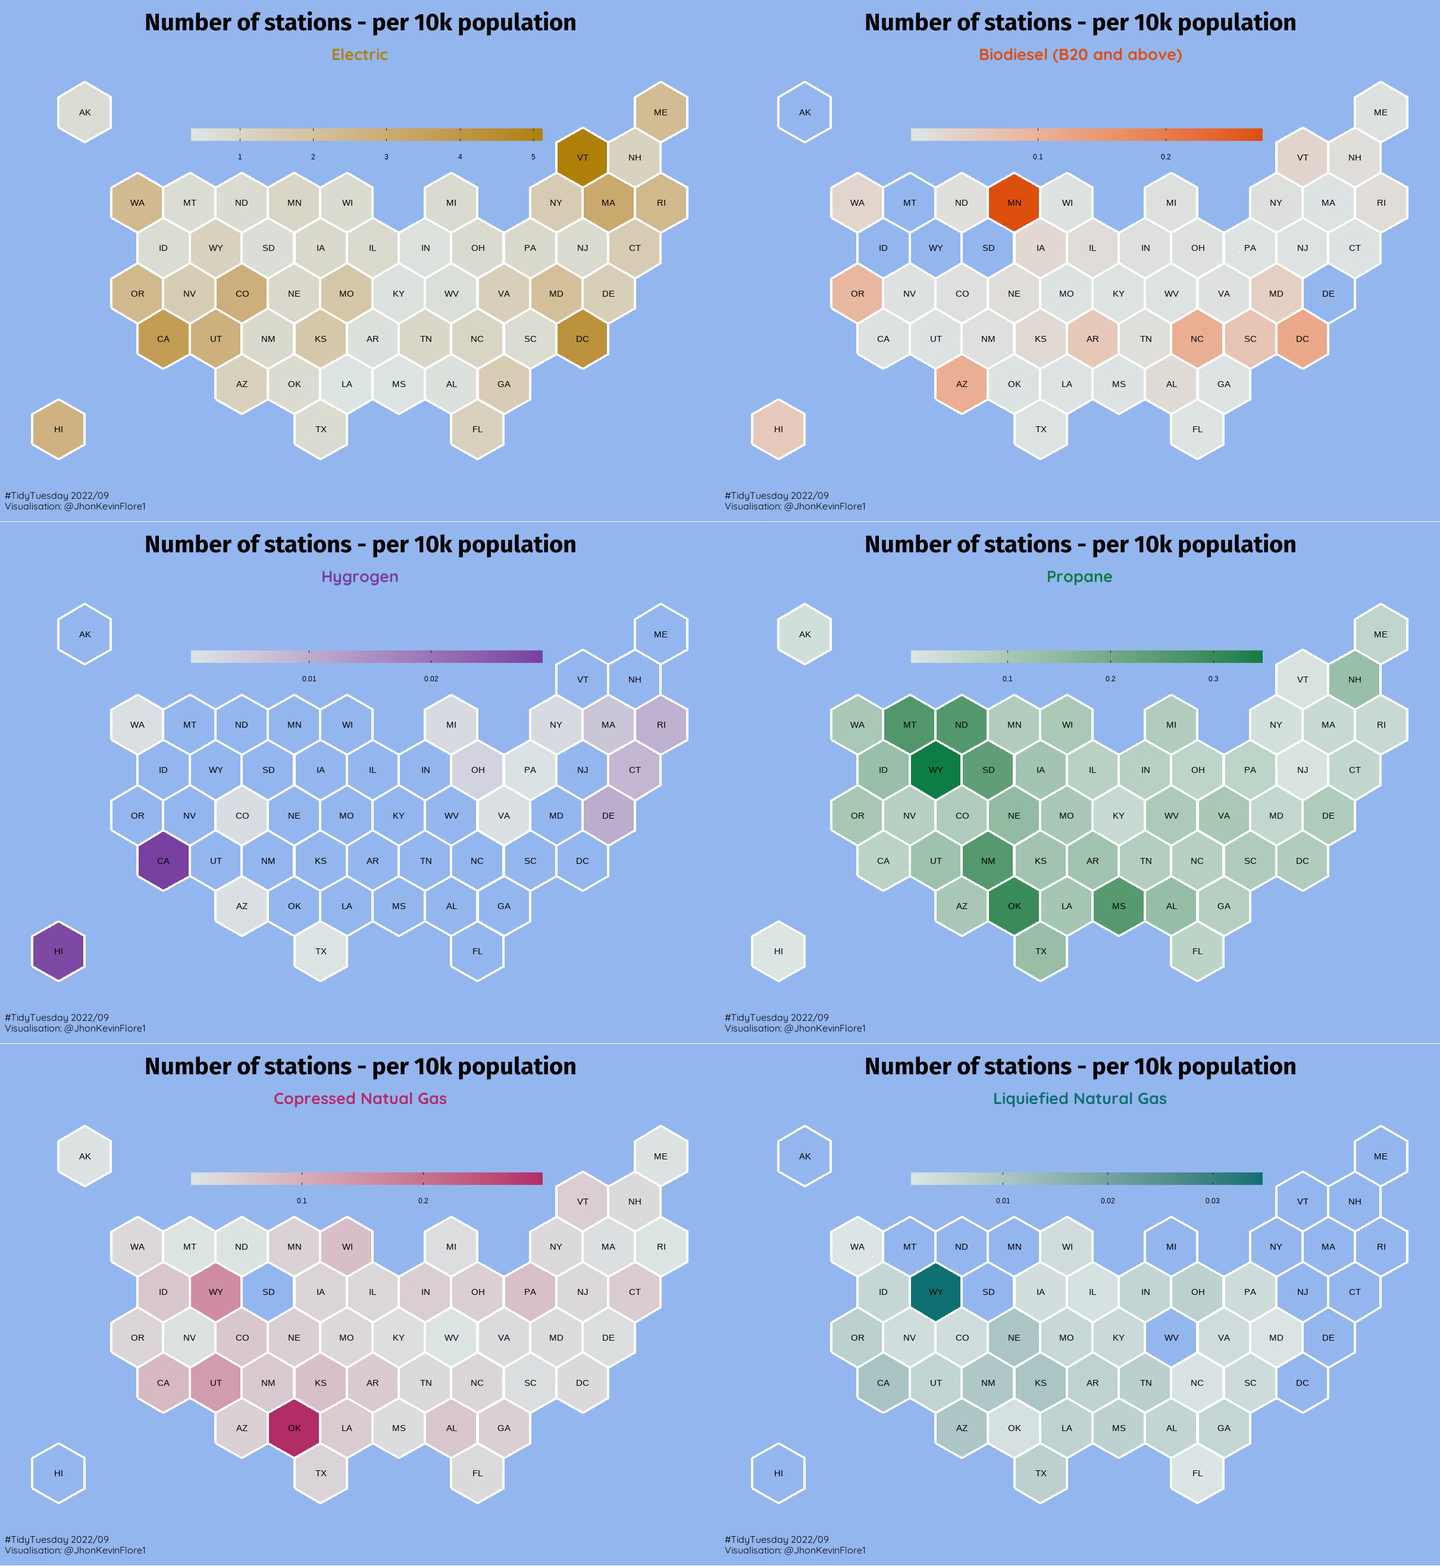
knitr::include_graphics('plots/22-09-stations.gif')
4 de marzo de 2022
font_add_google("Quicksand")
font_add_google("Fira Sans")

showtext::showtext_auto()

f1 <- "Quicksand"
f2 <- "Fira Sans"

stations <-
    tt_load("2022-03-01")$stations |>
    janitor::clean_names()


pop <-
    tibble::tribble(
  ~pop, ~state,
  5024279, "AL",
  733391, "AK",
  7151502, "AZ",
  3011524, "AR",
  39538223, "CA",
  5773714, "CO",
  3605944, "CT",
  989948, "DE",
  689545, "DC",
  21538187, "FL",
  10711908, "GA",
  1455271, "HI",
  1839106, "ID",
  12812508, "IL",
  6785528, "IN",
  3190369, "IA",
  2937880, "KS",
  4505836, "KY",
  4657757, "LA",
  1362359, "ME",
  6177224, "MD",
  7029917, "MA",
  10077331, "MI",
  5706494, "MN",
  2961279, "MS",
  6154913, "MO",
  1084225, "MT",
  1961504, "NE",
  3104614, "NV",
  1377529, "NH",
  9288994, "NJ",
  2117522, "NM",
  20201249, "NY",
  10439388, "NC",
  779094, "ND",
  11799448, "OH",
  3959353, "OK",
  4237256, "OR",
  13002700, "PA",
  1097379, "RI",
  5118425, "SC",
  886667, "SD",
  6910840, "TN",
  29145505, "TX",
  3271616, "UT",
  643077, "VT",
  8631393, "VA",
  7705281, "WA",
  1793716, "WV",
  5893718, "WI",
  576851, "WY"
)
stations10 <-
stations |>
count(
state
, fuel_type_code
, sort = T
) |>
left_join(pop) |>
mutate(
per10k = (n / pop) *10000
) |>
arrange(
desc(per10k)
, fuel_type_code
, state
) |>
with_groups(
fuel_type_code
, ~mutate(
.,
rk = row_number()
)
) |>
mutate(
fuel =
recode(
fuel_type_code
, "BD" = "Biodiesel (B20 and above)"
, "CNG" = "Copressed Natual Gas"
, "ELEC" = "Electric"
, "E85" = "Ethanol (E85)"
, "HY" = "Hygrogen"
, "LNG" = "Liquiefied Natural Gas"
, "LPG" = "Propane"
)
)usa_hex <- sf_NPR1to1
usa_hex_c <- sf_NPR1to1.centers |> PeruData::get_centroid()
station_fill <- left_join(usa_hex, stations10)
station_lbl <- left_join(usa_hex_c, stations10)
fuel <- unique(station_fill$fuel_type_code)
color_fuel <-
c(
"#af8007"
, "#dd4f0d"
, "#7840a0"
, "#1f33b7"
, "#0d7c45"
, "#b22c66"
, "#0e7070"
)
names(color_fuel) <- unique(station_fill$fuel)by_state <- function(x){
cli::cli_process_start("Copute {.val {x}}")
usa_sf <-
station_fill |>
filter(fuel_type_code == x)
alt_n <-
unique(usa_sf$fuel)
my_pal <- colorRampPalette(c("#dce5e5", color_fuel[[alt_n]]))
p <-
usa_sf |>
ggplot() +
geom_sf(aes(geometry = geometry, fill = per10k), color = "white") +
geom_sf(data = sf_NPR1to1, fill = NA, color = "white") +
geom_text(data = usa_hex_c, aes(x_center, y_center, label = state)) +
theme_void() +
scale_fill_gradientn(colours = my_pal(2), na.value = "gray20") +
guides(
fill = guide_colorbar(
barheight = unit(1.8, units = "mm"),
barwidth = unit(50, units = "mm"),
direction = "horizontal",
ticks.colour = "grey10",
title.hjust = 0.5
)
) +
labs(
subtitle = glue::glue("{alt_n}")
, title = "Number of stations - per 10k population"
, caption = " #TidyTuesday 2022/09\n Visualisation: @JhonKevinFlore1\n"
) +
theme(
legend.position = c(.5, .8)
, plot.title = element_text(hjust = .5, size = 30, family = f2, face = "bold")
, plot.background = element_rect(fill = "#94b6ef", color = NA)
, plot.subtitle = element_text(hjust = .5, size = 20, family = f1, color = color_fuel[[alt_n]], face = "bold")
, plot.caption = element_text(family = f1, lineheight = .3, size = 12, hjust = 0)
, legend.title = element_blank()
, legend.text = element_text(vjust = 1)
)
plot(p)
cli::cli_process_done()
}
animation::saveGIF(
{
purrr::walk(fuel, by_state)
}
, movie.name = here::here("plots", "22-09-stations.gif")
, interval = 2
, ani.width = 1210
, ani.height = 878
, ani.res = 300
)