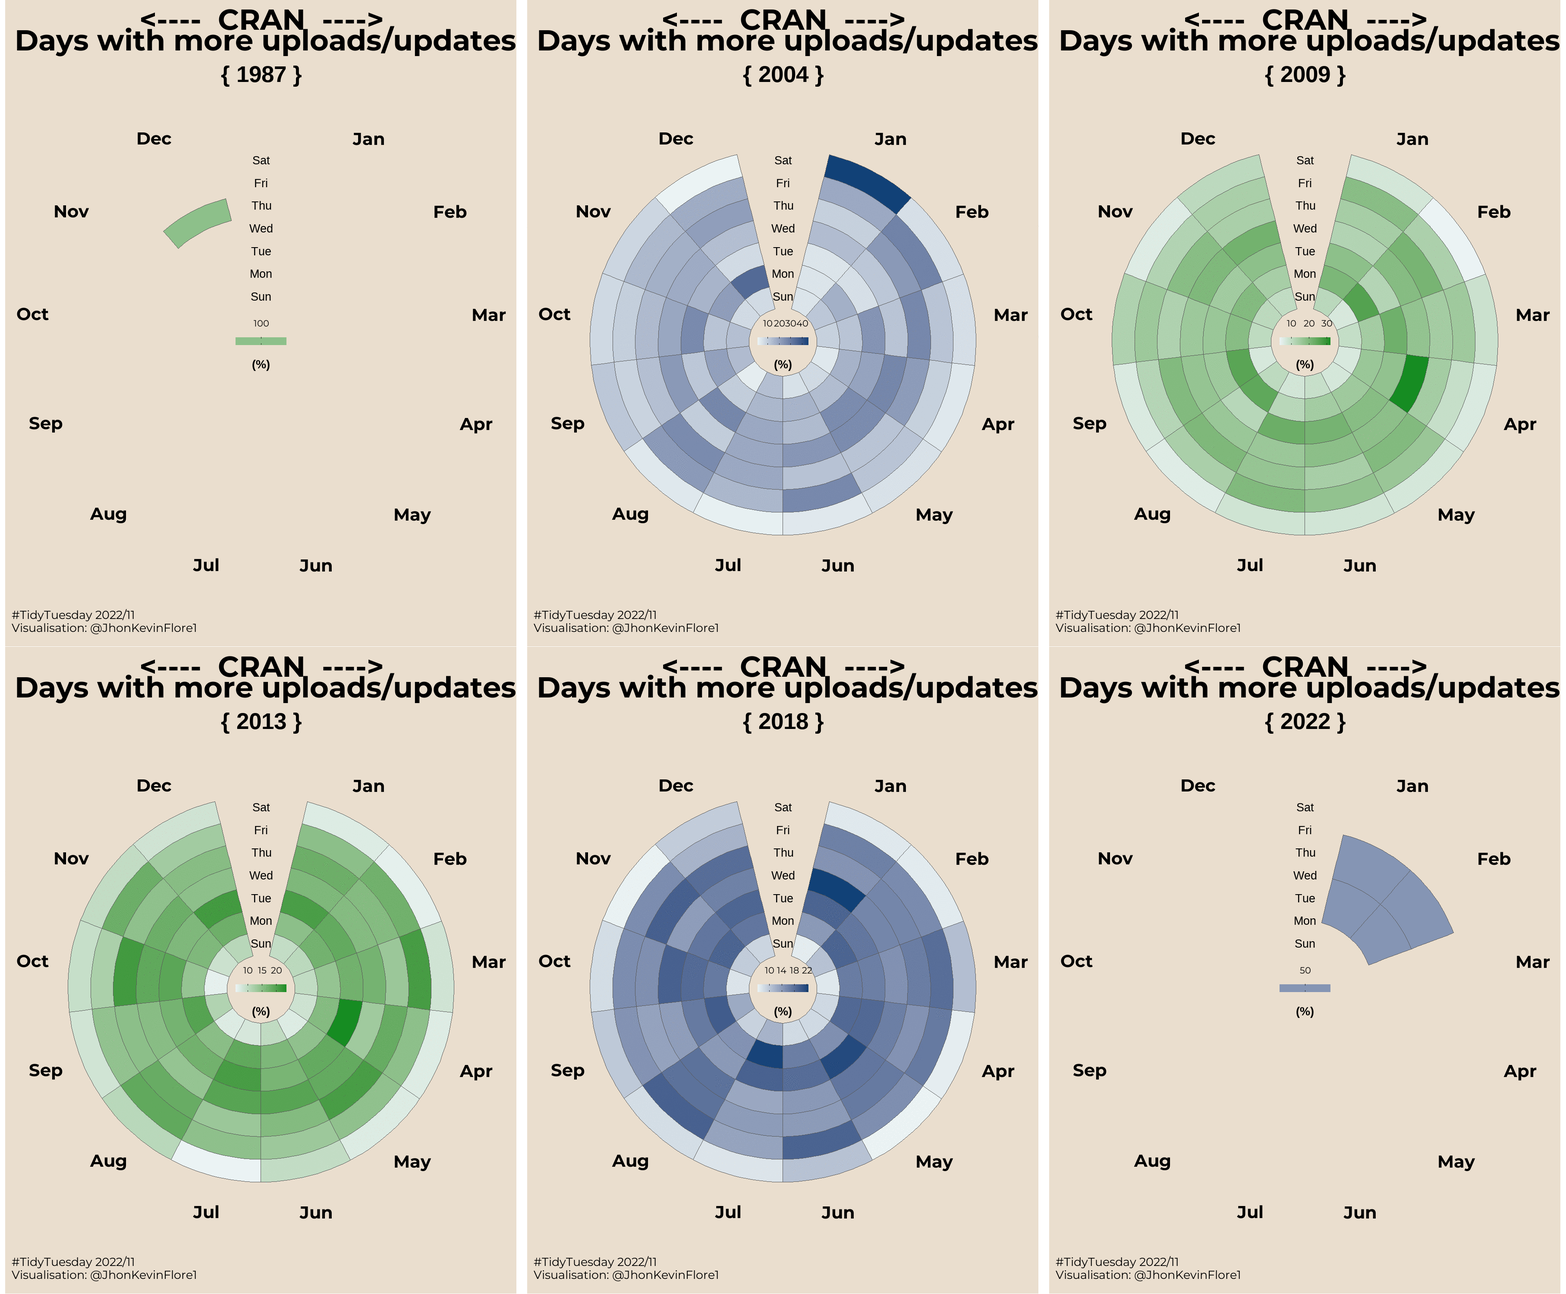
knitr::include_graphics("plots/22-11-cran.gif")
18 de marzo de 2022
day_upd <-
    cran |>
    mutate(
        fecha = ymd_hms(date) |> as_date()
        , fecha1 = paste0(str_sub(date, -4, -1), str_sub(as_date(date, format = "%a %b %d"), 5, -1)) |>
            ymd()
        , date = ifelse(is.na(fecha), fecha1, fecha) |> as_date()
        , day = wday(date, label = T)
        , mes = month(date, label = T)
        , anio = year(date)
    )  |>
    filter(date < lubridate::today()) |>
    select(!contains(c("fecha", "date")))


d_n <- length(levels(d_16$day))
# t_p <- colorRampPalette(c("#ebf3f4", "#168c22"))
m_c <- c("#168c22", "#114177")my_plot <- function(.anio) {
cli::cli_process_start("Copute {.val {.anio}}")
if(.anio %% 2 == 1) jj <- "#168c22" else jj <- "#114177"
t_p <- colorRampPalette(c("#ebf3f4", jj))
semi_df <-
main_df |>
filter(anio == .anio)
p <-
semi_df |>
ggplot(color = 'black') +
aes(x = mes, y = as.numeric(day), fill = f_d) +
geom_tile(color = "grey35") +
coord_polar(start = -.24) +
xlim(c("", levels(d_16$mes))) +
ylim(c(-1, d_n + 1)) +
annotate(
x = ""
, y = 1:d_n
, geom = "text"
, label = levels(d_16$day)
, size = 7
) +
labs(
subtitle = paste("{", .anio, "}")
, fill = "(%)"
, title = "<---- CRAN ---->\n Days with more uploads/updates"
, caption = " #TidyTuesday 2022/11\n Visualisation: @JhonKevinFlore1\n"
) +
scale_fill_gradientn(colors = t_p(2)) +
guides(
fill = guide_colorbar(
barheight = unit(1.5, units = "mm"),
barwidth = unit(10, units = "mm"),
direction = "horizontal",
ticks.colour = "grey10",
title.position = "bottom",
label.position = "top",
title.hjust = 0.5)
) +
theme_void() +
theme(
legend.position = c(.5, .5)
# , legend.key.size = unit(.2, "cm")
, legend.text = element_text(size = 16, vjust = -4, family = t1)
# , legend.text.align = -1
, legend.title = element_text(hjust = .5, size = 20, face = "bold", vjust = 2)
, axis.text.x = element_text(color = "black", hjust = 1, size = 30, face = "bold", family = t1)
# , axis.text = element_text(color = "black", hjust = 1, size = 30)
, plot.subtitle = element_text(hjust = .5, face = "bold", size = 40)
, plot.title = element_text(hjust = .5, face = "bold", size = 50, family = t1, lineheight = .19)
, plot.background = element_rect(fill = "#eadece", color = NA)
, plot.caption = element_text(t1, size = 20, lineheight = .3, hjust = 0)
)
# return(semi_df)
plot(p)
cli::cli_process_done()
}
anios <- unique(main_df$anio)