librarian::shelf(
  tidyverse
  , gg3D
  , PeruData
  , raster
  , sf
)


hyo0 <-
  filter(map_peru_prov, prov == "huancayo")

hyo <-
  raster_peru_alt |>
  mask(hyo0) |>
  rasterToPoints() |>
  as_tibble() |>
  rename(alt = 3)

min_h <- min(hyo$alt)
max_h <- max(hyo$alt)

theta <- 10
phi <- 0


alt_cl <- colorRampPalette(
  c(
    "#aa500b"
    , "#0b68aa"
    , "#13a506"
    )
)Day 14
R
Data Viz
ggplot2
Data analysis
Day 14 from #30dataChartChallenge
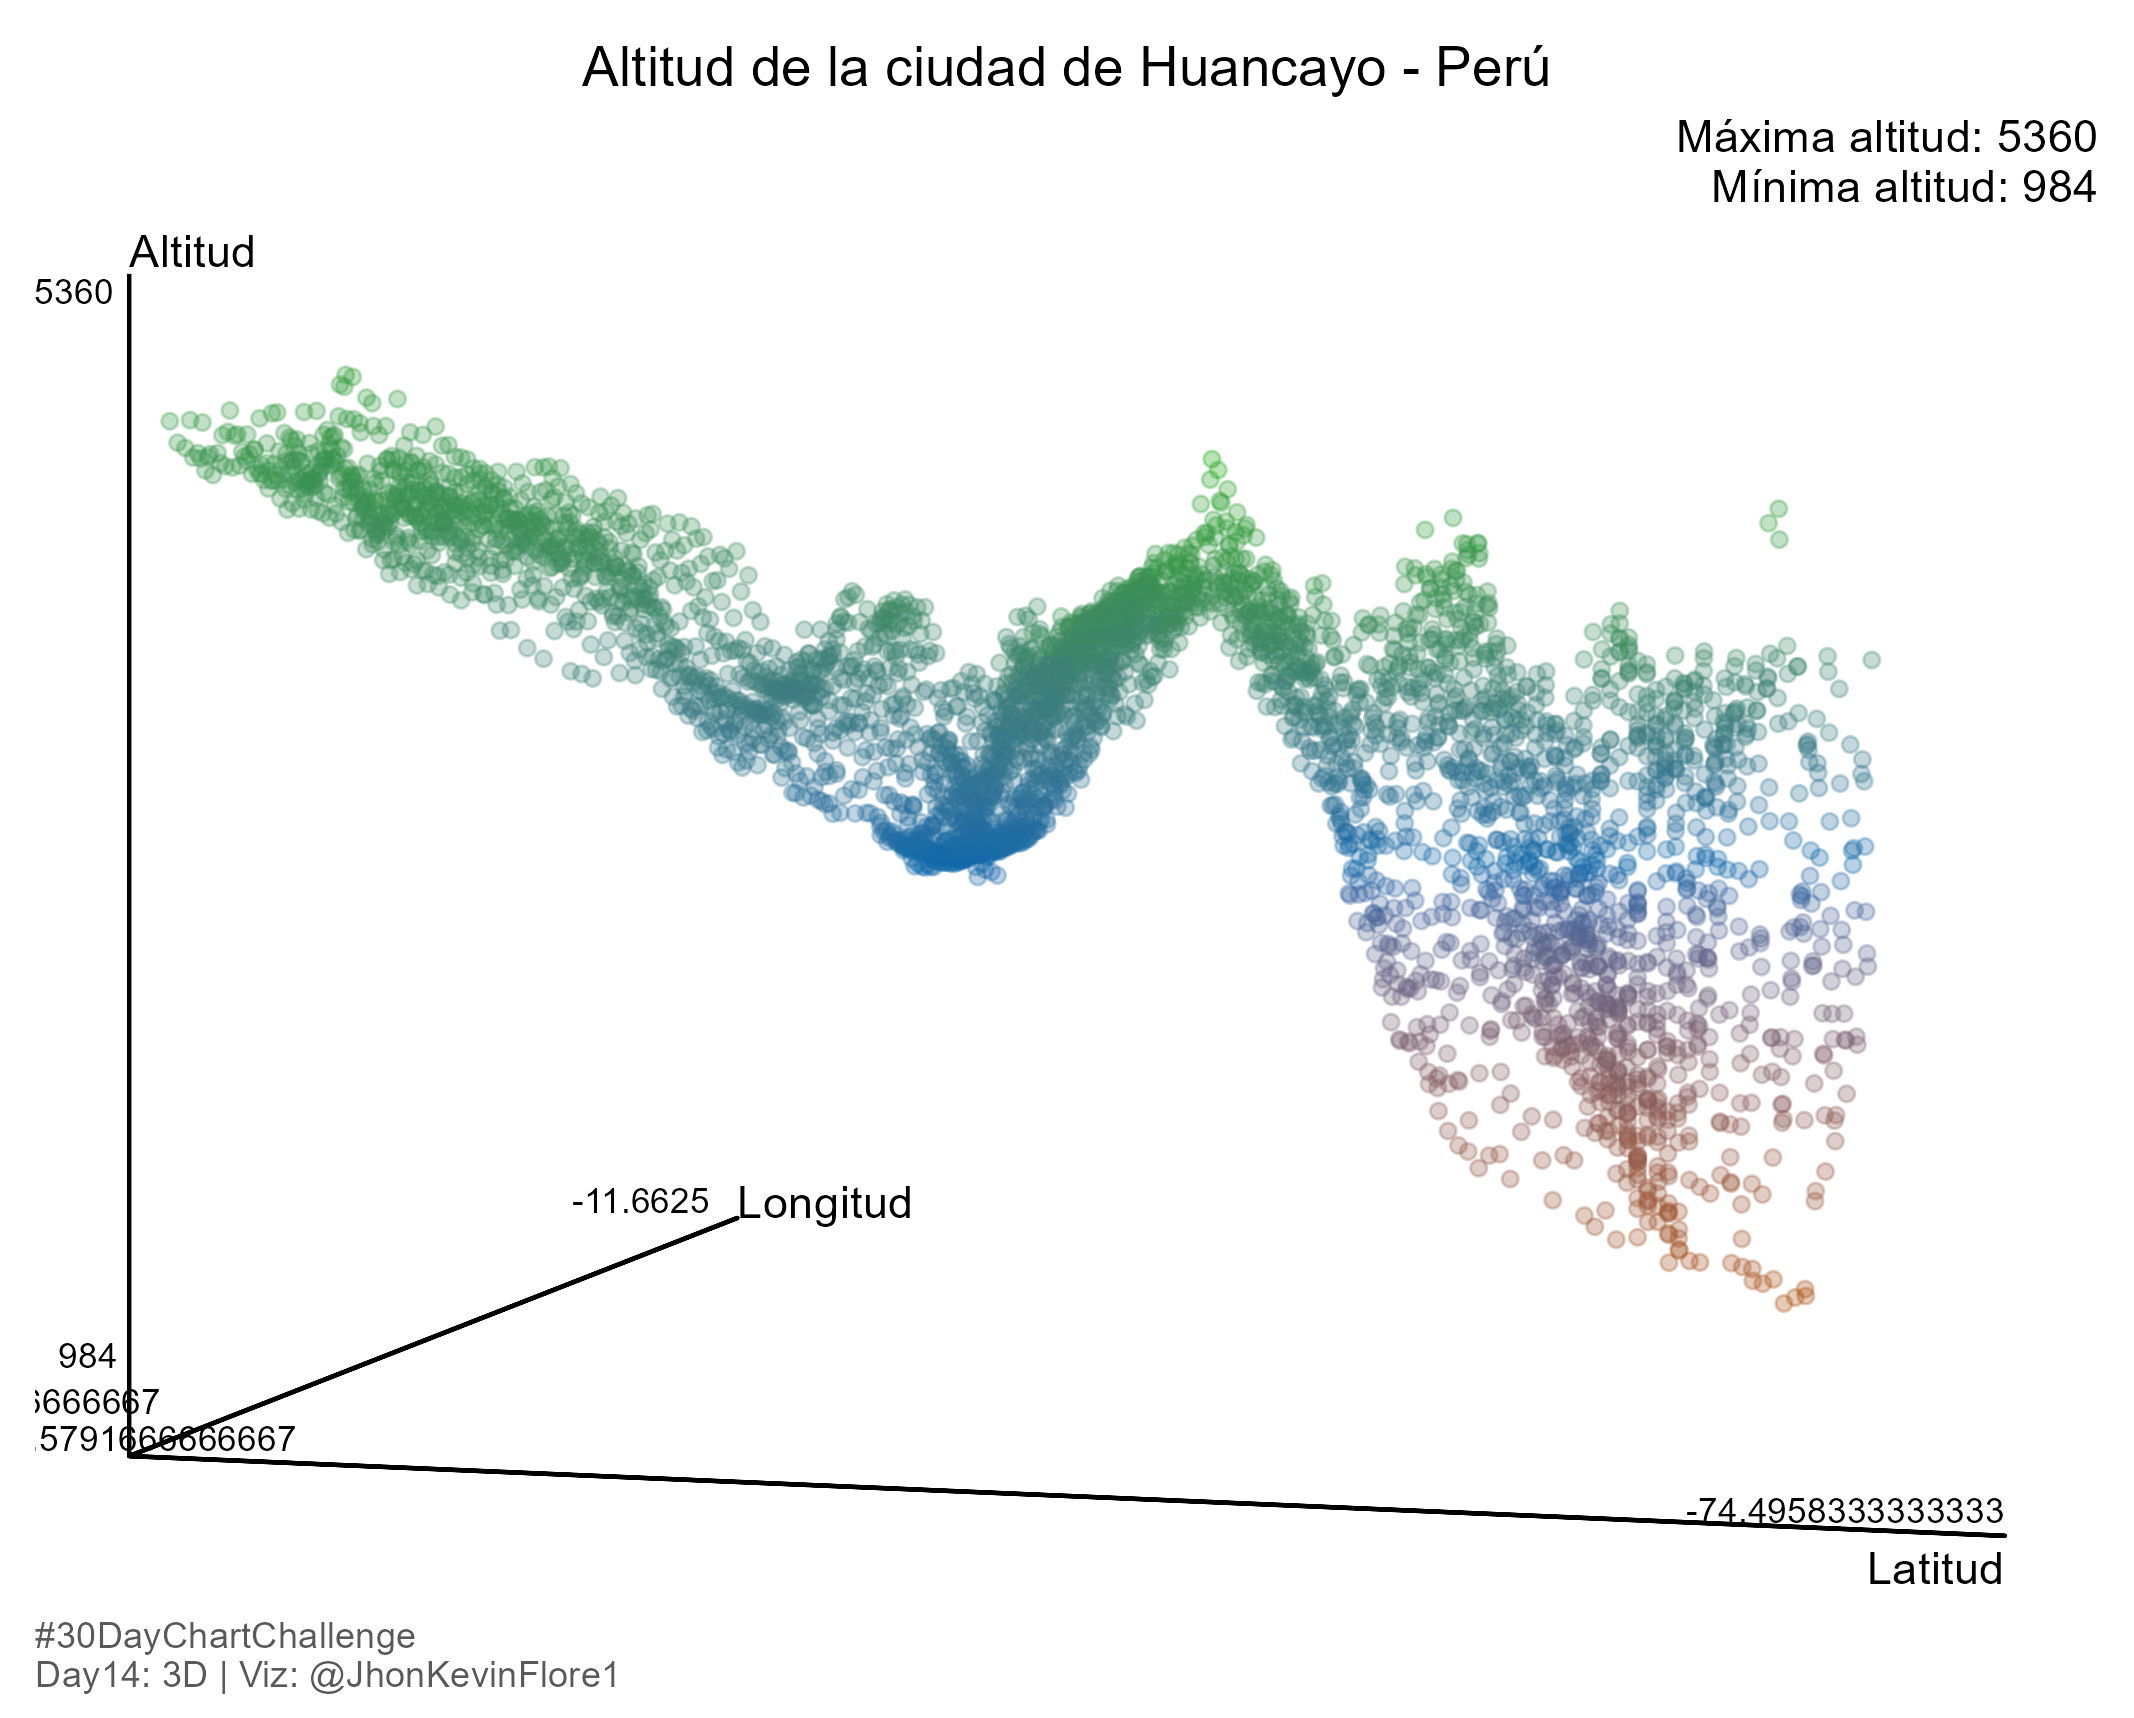
p <- ggplot(hyo, aes(x=x, y=y, z=alt, color = alt)) +
  axes_3D(theta=theta, phi=phi) +
  stat_3D(theta=theta, phi=phi, alpha = .3) +
  # stat_wireframe(alpha = .5) +
  axis_labs_3D(theta=theta, phi=phi, size=3,
               hjust=c(1,1,1.2,1.2,1.2,1.2),
               vjust=c(-.5,-.5,-.2,-.2,1.2,1.2)) +
  labs_3D(theta=theta, phi=phi,
          hjust=c(1,0,0), vjust=c(1.5,0,-.2),
          labs=c("Latitud", "Longitud", "Altitud")) +
  theme_void() +
  labs(
    title = "Altitud de la ciudad de Huancayo - Perú"
    , subtitle = glue::glue("Máxima altitud: {max_h}\nMínima altitud: {min_h}")
    , caption = "#30DayChartChallenge\nDay14: 3D | Viz: @JhonKevinFlore1"
  ) +
  scale_color_gradientn(colours = alt_cl(3)) +
  theme(
    panel.background = element_rect("white", color = NA)
    , plot.background = element_rect("white", color = NA)
    , plot.title = element_text(hjust = .5)
    , plot.subtitle = element_text(hjust = 1)
    , legend.position = "none"
    , plot.margin = margin(2, 3, 2, 3, "mm")
    , plot.caption = element_text(hjust = 0, color = "grey35")
)ggsave(
'plots/day14_dcc_22.png'
)knitr::include_graphics("plots/day14_dcc_22.png")