p <-
inf |>
ggplot() +
aes(anio, d) +
# geom_point() +
geom_hline(yintercept = 0) +
geom_segment(
aes(y = 0, yend = d, x = anio,color = col, xend = anio)
, arrow = arrow(type = "closed", length = unit(2.9, "mm"))
, size = 1.5
) +
facet_wrap(~none, scales = "free_y", ncol = 1) +
scale_x_discrete(breaks = c(2011, 2015, 2019, 2020)) +
scale_y_continuous(labels = scales::comma) +
scale_color_manual(
values = c("#092f60", "#d3431f")
) +
labs(
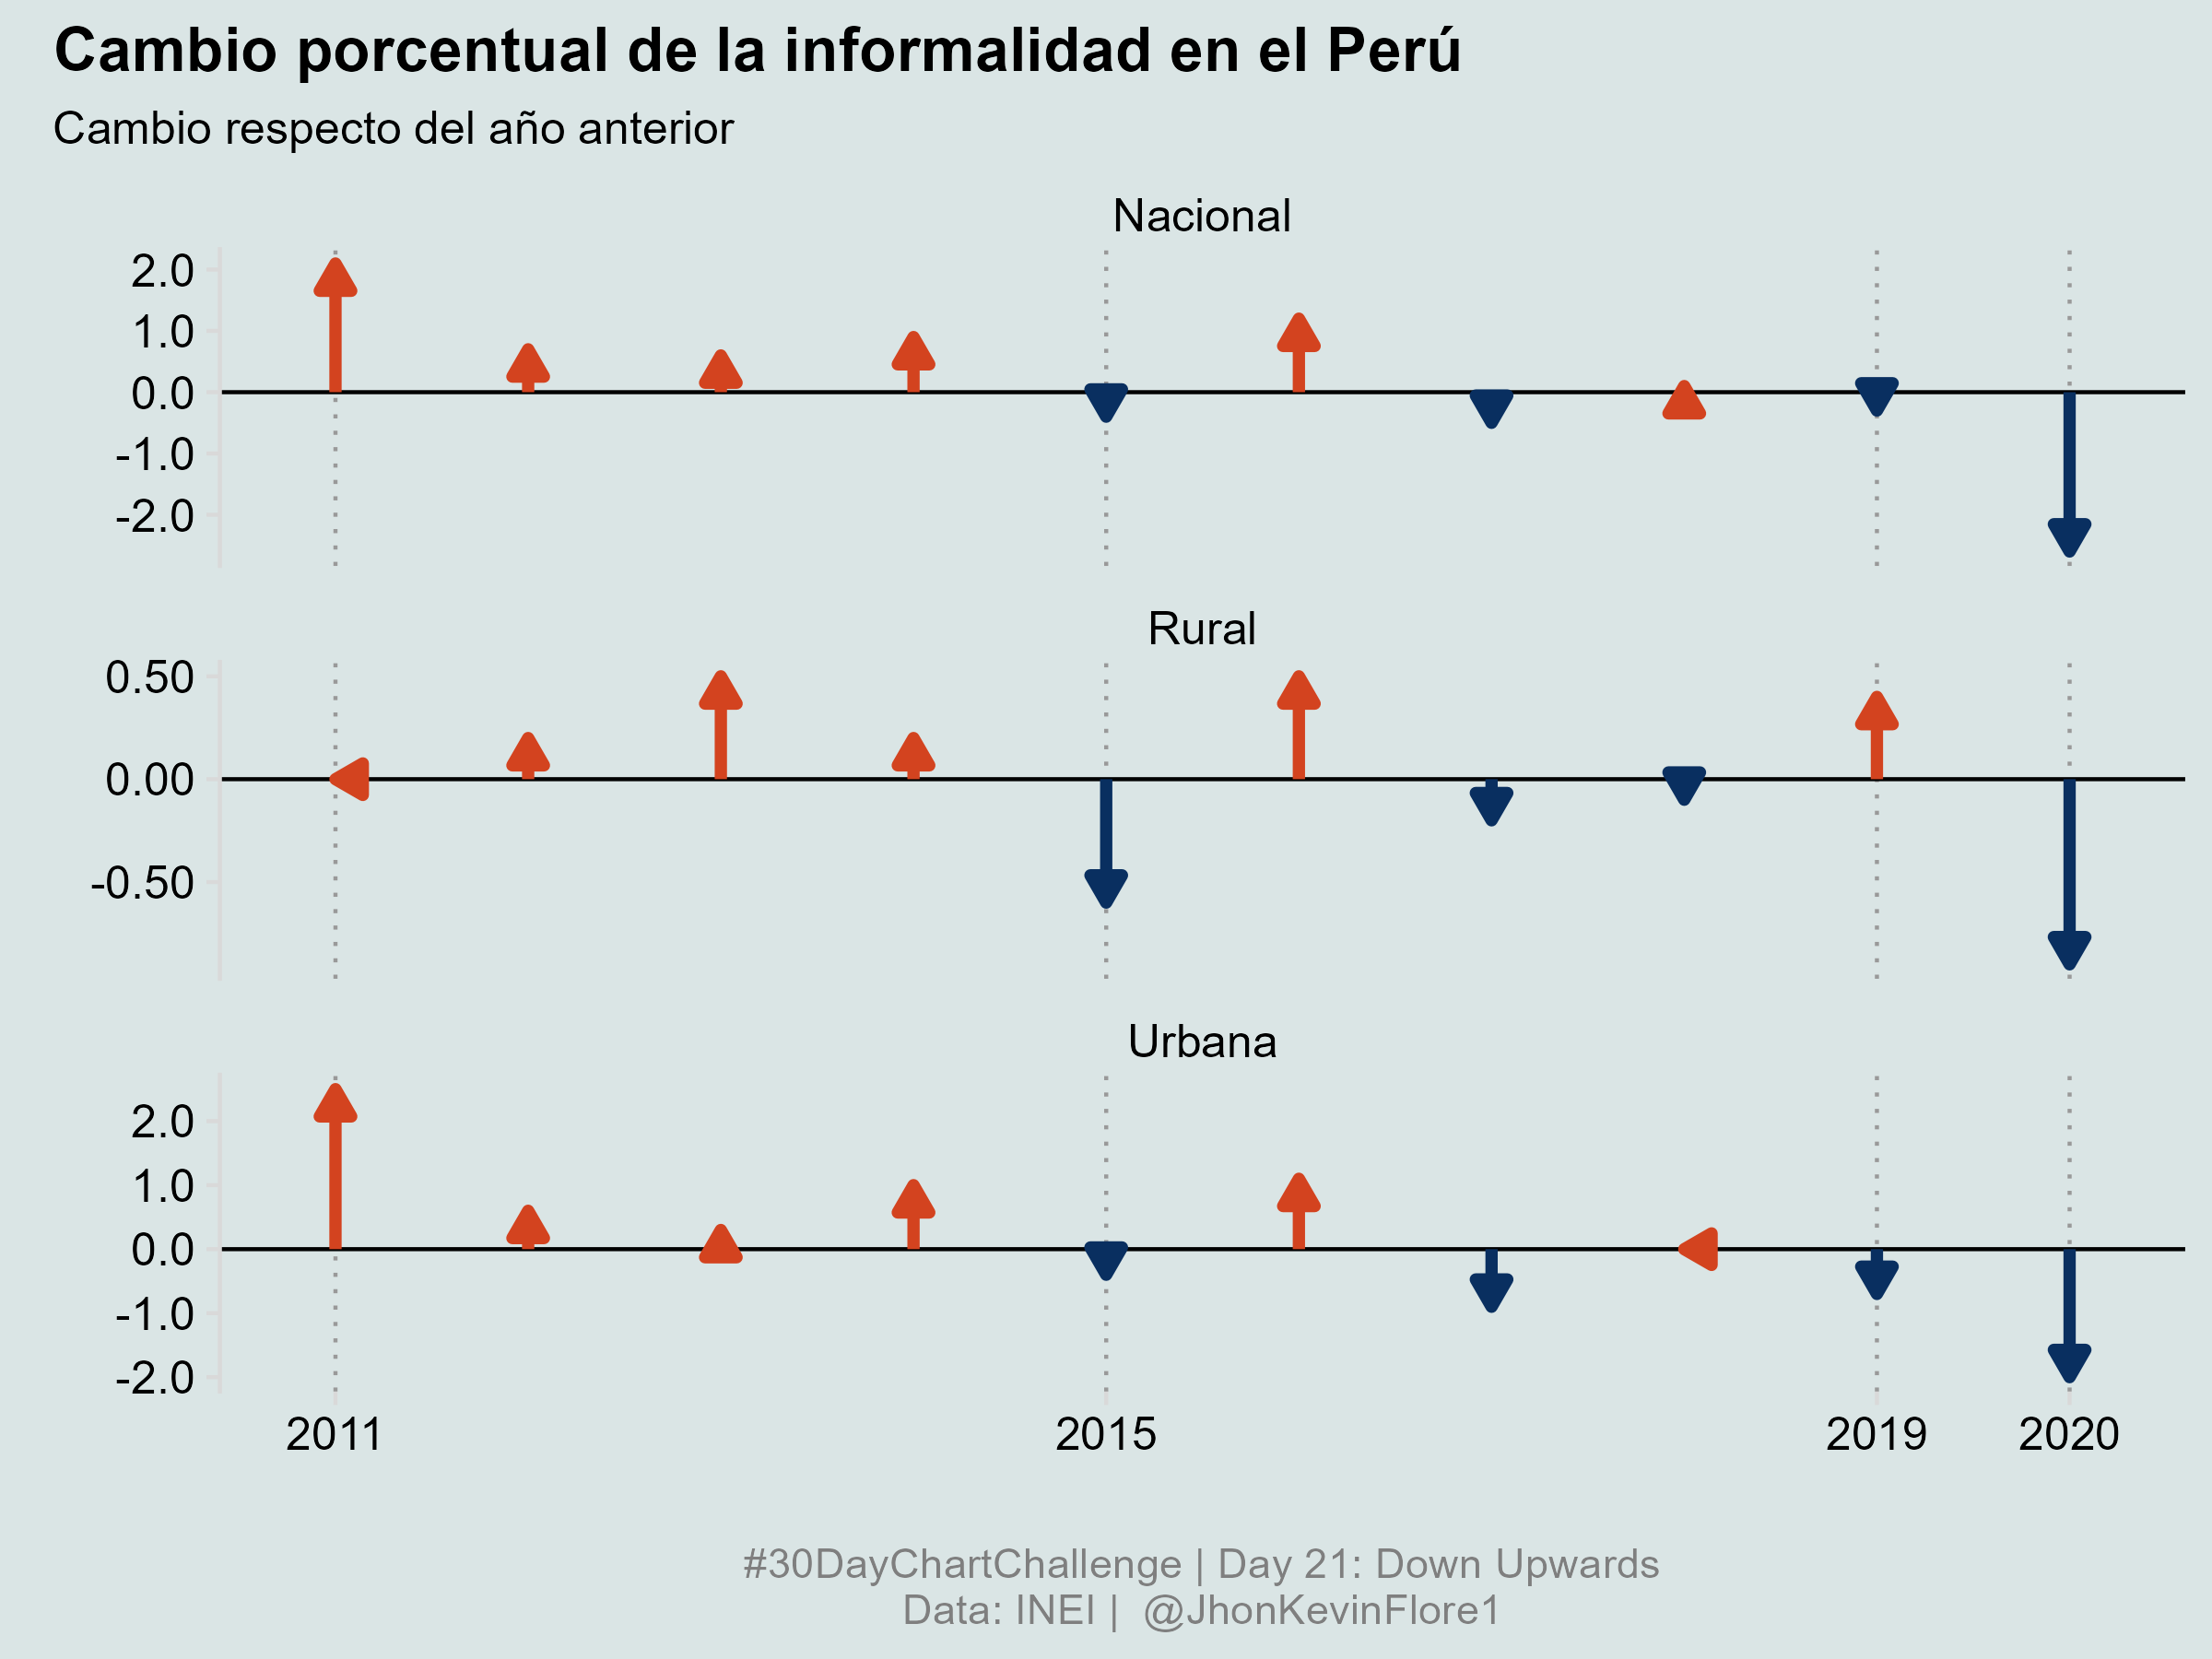
title = "Cambio porcentual de la informalidad en el Perú"
, subtitle = "Cambio respecto del año anterior"
, x = ""
, y = ""
, caption = "#30DayChartChallenge | Day 21: Down Upwards\nData: INEI | @JhonKevinFlore1"
)+
cowplot::theme_minimal_vgrid() +
theme(
legend.position = "none"
, panel.grid.major.x = element_line(
linetype = "dotted"
, color = "gray60"
)
, plot.caption = element_text(hjust = .5, color = "grey50")
, plot.title = element_text(hjust = -.3)
, plot.subtitle = element_text(hjust = -.13)
)
ggsave(
plot = p
, 'plots/day21_dcc_22.png'
, height = 6
, width = 8
, bg = "#dae5e5"
)